Pandas has a hard job (and does it well)
May 26, 2020 by Michael Chow
I’ve had to dive into pandas’ code base over the last year for a project (siuba), and my attitude has shifted dramatically from..
- old attitude: why does pandas have to make things so hard?
- new attitude: pandas has a crazy difficult job.
I think this is most apparent in the functions that decide what dtype a Block—the most basic thing that stores data in pandas—should be.
For the ubiquitous Object dtype, it often figures out which of the many possible more specific types to cast it to.
Ask yourself what this outputs:
import pandas as pd
import numpy as np

np.array([np.nan, "a"])
Lo and behold—it produces an array where the np.nan has been converted to the string “nan”.
array(['nan', 'a'], dtype='<U32')
And yet,
pd.Series([np.nan, "a"])
0    NaN
1      a
dtype: object
Knows this, has your back, and does not stringify it!
pandas has your back #
pandas also has a pathological fixation on when it tries to convert dtypes, since avoiding all the bad conversion outcomes is a relatively time intensive process (compared to e.g. creating a numpy array).
I realize things could be much easier in pandas user facing interface, but really appreciate the sheer amount of effort that has gone into its dtype wrangling.
It is a building block for incredible tools #
Here are three libraries built in large part on pandas.
- ibis - similar to R library dplyr. Performs analyses on top of pandas DataFrames or SQL databases. Some of the maintainers are also pandas devs.
- geopandas - working with geographic data.
- dask - parallel computing and task scheduling over DataFrames
It’s worth noting that if you are a user coming from dplyr, the ibis library is probably a closer fit to what you’re looking for.
It has made porting dplyr to python easy #
As I’ve worked on siuba—a port of dplyr to python—I’ve had to read code from dplyr’s ecosystem of packages, the Tidyverse. Looking through Tidyverse source code, it is clear to me that Tidyverse developers often have to do two things…
- implement a good chunk of core logic / calculations
- build a nice user interface on top
While porting dplyr’s user interface over, I’ve been increasingly surprised that pandas has already done the heavy lifting on the underlying calculations. Often, I am just wrapping a couple pandas methods, handling some edge cases, and resetting indexes.
A good example of this was implementing the spread() function.
Porting spread to siuba #
The spread function in dplyr focuses on shaping data from a longer to a wider format, based on a pair columns:
- measure - each entry is the name of a different measurement
- value - each entry is the value for that measurement
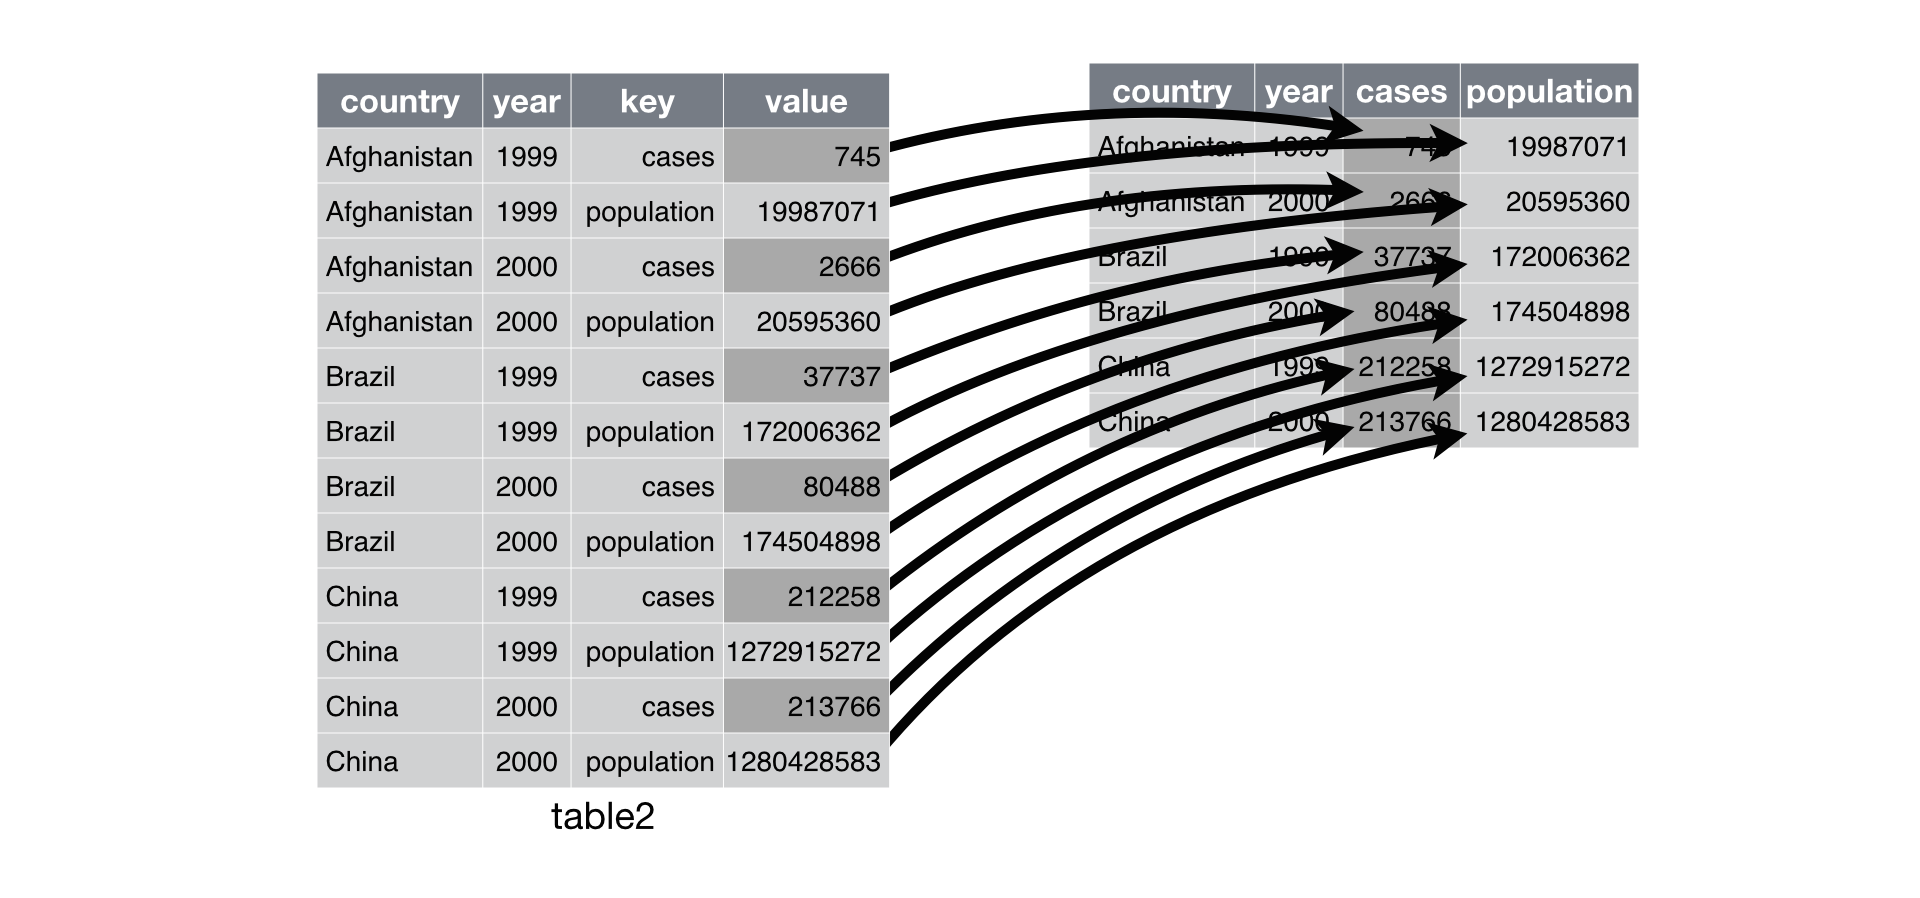
The data is transformed so that each kind of measurement gets its own column.
For example, the figure below—taken from R for Data Science—shows the original data on the left, which measures “cases” and “population” for different countries over time. Here, the measure column is named key.
It shows how spread() maps the values to create the data on the right.
In pandas, this can roughly be achieved with the code below.
wide = long.pivot_table(index = ["Country", "year"], columns = "key")

wide
                   value
key                cases  population
Country     year
Afghanistan 1999     745    19987071
            2000    2666    20595360
Brazil      1999   37737   172006362
            2000   80488   174504898
China       1999  212258  1272915272
            2000  213766  1280428583
This gets us most of the way there, but there are two big downsides with this result:
- it uses MultiIndex objects for both the rows and columns.
- the MultiIndexes have a “name” attribute set.
These two things can make the DataFrame difficult to use and reason about, because you have to use different strategies when operating on indexes. One of siuba’s main job is to reset them, so that as much data as possible is stored as columns.
As it turns out, this is a little bit complicated.
(wide
    .droplevel(0, axis=1)
    .reset_index()
    .rename_axis(columns = lambda x: None)
    )
       Country  year   cases  population
0  Afghanistan  1999     745    19987071
1  Afghanistan  2000    2666    20595360
2       Brazil  1999   37737   172006362
3       Brazil  2000   80488   174504898
4        China  1999  212258  1272915272
5        China  2000  213766  1280428583
When doing data analysis, having to do this kind of fine-grained index and name fiddling is probably not what you want. However, as a developer, this kind of granularity is pretty powerful—and it made implementing spread() a quick task!
Altogether, the final siuba code to produce the above result is more of a convenience wrapper.
from siuba import _, spread

# spreading from longer to wider format
spread(long, _.key, _.value)
(Note: siuba uses the unstack method in its spread implementation, rather than pivot_table, but the idea is the same.)
pandas’ flexibility makes more powerful functions possible #
Recently, dplyr released more general versions of spread, and gather—called pivot_wider and pivot_longer.
As a testament to pandas flexibility, it looks like all the functionality to port these functions is already there.
Summary #
pandas is a useful tool for data analysis in its own right. When you’re using it, you might miss some of the difficult jobs it is doing for you, like ensuring reasonable behavior around data types.
But that’s only half the picture. It also serves as a foundation for a lot of interesting tools, like…
- ibis - dplyr-like analyses on top of pandas DataFrames or SQL databases. Some of the maintainers are also pandas devs.
- plotnine - a faithful port of ggplot. Built on matplotlib.
It seems like there’s been a lot of frustration surfacing on twitter lately from people coming from R—especially if they’ve used dplyr and ggplot—towards pandas and matplotlib. I can relate. I’m developing a port of dplyr to python. But in the end, it’s probably helpful to view these libraries as foundational to a lot of other, higher-level libraries (some of which will hopefully get things right for you!).